


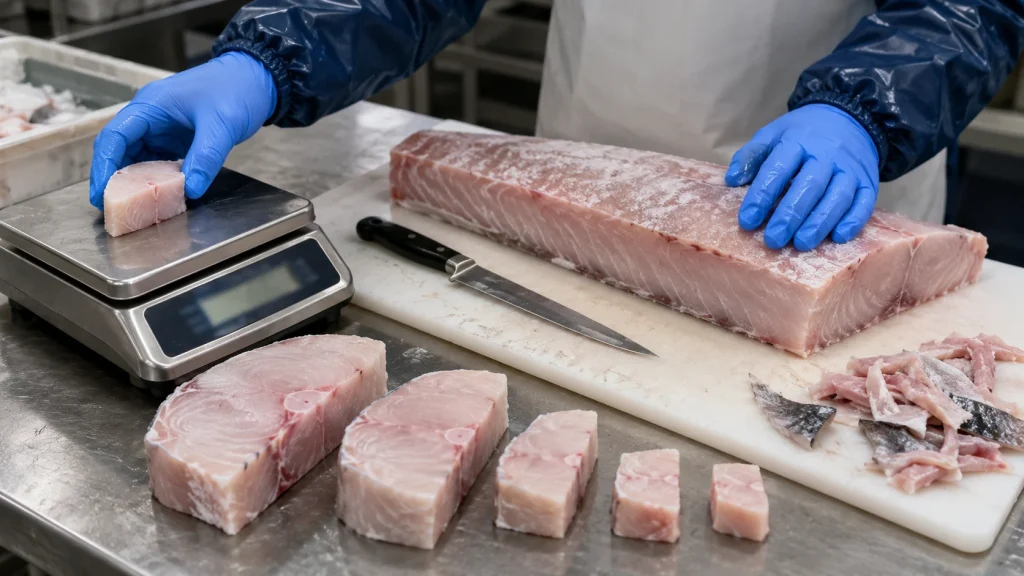
The fish with the lowest price per kilogram is not always the least expensive fish to put on a plate.
Whole fish, headed-and-gutted fish, fillets, loins, steaks, and fixed-weight portions may all come from the same species, but each format shifts trimming, waste, labor, and portion control to a different point in the supply chain. When a restaurant buys a more processed product, it pays the processor to handle more of that work. When it buys a less processed fish, more of the work, yield risk, and portioning responsibility stays in the kitchen.
For foodservice buyers, purchase price alone is therefore a poor basis for comparison. A more useful figure is the cost of producing a consistent, usable serving after trimming, preparation, and cooking.
Fish cut affects how much purchased weight becomes usable product
Different cuts contain different amounts of material that will not become part of the main menu portion.
A whole fish may still include the head, viscera, bones, skin, fins, and other material that must be removed. Headed-and-gutted fish have already gone through some of that processing. Filleting removes much of the skeleton, while additional trimming may remove belly flaps, skin, pin bones, uneven edges, or other parts depending on the specification.
NOAA’s fish grading guidance shows why the terminology matters. A whole fillet and a trimmed fillet are not necessarily equivalent products because trimming can remove additional material after filleting. Steaks, meanwhile, are cross-sections cut approximately perpendicular to the backbone and can have a different bone and skin configuration from fillets.
As a result, two suppliers can quote the same species at different prices per kilogram while offering products with very different usable yields.
FAO reference data show how wide those differences can be. Selected skinless-fillet yields from whole fish are reported at approximately 34% for cod, 35% for haddock, and 54% for Atlantic mackerel. In another FAO processing example involving scad, hand-cut untrimmed skin-on fillets yielded roughly 40 to 45% of whole fish, while further-trimmed skin-on fillets yielded around 34 to 38%. Headed-and-gutted fish retained about 66 to 68%.
These figures should not be treated as standard yields for every order. Species, fish size, condition, season, anatomy, trimming requirements, and processing skill can all affect the result. They are useful because they show why one generic “fillet yield” cannot be applied to every seafood product.
Cost the edible portion, not only the purchased kilogram
A basic foodservice yield calculation compares as-purchased weight with edible-portion weight:
Yield % = usable edible weight ÷ purchased weight × 100
The same principle can be applied to purchase cost:
Usable product cost per kg = purchase price per kg ÷ yield fraction
Suppose a less processed fish costs 5 units of currency per kilogram and produces a 45% usable yield. Before labor and cooking loss are considered, the usable fish effectively costs:
5 ÷ 0.45 = 11.11 per usable kg
A more processed product costing 8 per kilogram but producing a 75% usable yield would cost:
8 ÷ 0.75 = 10.67 per usable kg
The second product looks considerably more expensive on the supplier quotation, yet it is slightly cheaper when compared on the basis of usable weight.
The exact numbers will vary by product, but the principle remains the same. Quoted price per kilogram tells the buyer what enters the kitchen. Yield determines how much of that weight can actually be used.
Foodservice yield guidance also recommends testing the product itself rather than relying only on reference percentages. A practical yield test weighs the incoming fish and then records the primary usable cut, trim, skin, bones, and other material separately.
Testing several fish gives a more useful picture than testing a single specimen because fish naturally vary in size, shape, and condition.
More processing can reduce kitchen labor
Yield is only part of the cost. Buyers also need to consider how much preparation remains after the product arrives.
Whole or partly processed fish may require kitchen staff to head, fillet, skin, debone, trim, portion, weigh, and clean up after fabrication. Buying trimmed loins, steaks, or fixed-weight portions moves some or most of those tasks to the processor.
Processing data show how much labor can vary by stage. One Indonesian study of skinless cobia processing reported worker productivity of about 184.61 kg/hour/person during filleting, 112.58 kg/hour/person during deboning, and only 25.42 kg/hour/person during the more detailed skinning and trimming stage.
These figures are specific to the operation studied and should not be treated as universal production benchmarks. Equipment, worker experience, product temperature, species, fish size, and specification can all affect productivity.
The broader purchasing point is straightforward: detailed trimming and portion preparation take time. When the supplier performs those operations, part of the higher product price pays for work that would otherwise have to be done in the buyer’s facility.
For a restaurant with skilled fish cutters, enough prep time, and useful applications for secondary cuts, keeping more fabrication in-house may make sense. A high-volume kitchen built around fast, repeatable service may place more value on receiving fish closer to its final serving specification.
Fish size can affect the yield of the same cut
Cut name alone does not determine yield. The size of the incoming fish can also affect how efficiently it can be converted into the required product.
An Indonesian tuna-processing study, for example, found that loin represented about 55% of fish below 30 kg and about 59% in the larger size group studied. The amount that could later be converted into saku also varied with fish size.
Other processing studies show how yield changes as the product is trimmed to a tighter specification. A frozen marlin-steak study reported yields of 69.24% after loin formation and skinning, 56.97% after trimming, and 37.92% once the product reached steak formation. A tuna-steak processing study reported 69.40% at loin formation, 45.11% after trimming, and 40.48% after steak formation.
These findings are not universal yield standards. They come from specific species, plants, processing methods, and product specifications.
They do, however, show what happens when a buyer requires a more specific final shape. More of the starting material may fall outside the primary product specification. If a menu calls for uniform center-cut steaks, for example, tapering tails and irregular sections may need to be directed to another product instead.
Fish size grade, cut specification, and final portion requirements should therefore be considered together.
Portion size affects menu cost even when fabrication yield stays the same
Once a usable fillet or loin has been produced, portion weight becomes another cost variable.
One kilogram of usable fish provides approximately:
| Target raw portion | Theoretical portions per kg |
|---|---|
| 150 g | 6.67 |
| 180 g | 5.56 |
| 200 g | 5.00 |
| 250 g | 4.00 |
A relatively small change in portion weight can reduce the number of servings available from every kilogram or carton.
Consistency matters just as much as the target weight. If a menu is costed around a 180 g raw portion but the actual portions served average 190 g, fish usage is about 5.6% above the planned amount for every serving.
That difference may seem minor on a single plate. Across hundreds or thousands of servings, however, it changes food cost and causes inventory to run down faster than the menu-cost calculation predicts.
Fixed-weight or tightly graded portions can reduce this variation. NOAA’s raw fish portion grading standards, for example, recognize both weight and size uniformity as product-quality characteristics. The tolerances in that system are not universal purchasing rules, but they show that portion consistency can be measured rather than judged only by appearance.
For B2B purchasing, a specification such as “180 g portion” may therefore be too broad on its own. Buyers may also need to define an acceptable weight range, thickness, dimensions, cut position, skin condition, and bone requirement.
Raw portion weight is different from cooked serving weight
Another costing error is assuming that the weight received from the supplier will be the weight served to the customer.
Fish usually loses some weight during cooking. The amount varies with species, cut, thickness, moisture condition, and cooking method.
The USDA Food Buying Guide uses a standardized factor under which 1 lb of fresh or frozen fish fillets produces approximately 0.70 lb of cooked fish. NOAA reference factors likewise use about 70% for certain fresh or frozen fillets and 78% for products cut from regular frozen fish blocks.
These figures are useful reference points, not guaranteed yields for every product or kitchen.
Using the 70% factor only as an example, a 180 g raw portion would produce approximately 126 g of cooked fish. If a menu is designed around roughly 180 g after cooking, the raw starting portion would need to be considerably larger.
A restaurant’s own cooking test is therefore more useful for menu costing than relying indefinitely on a generic reference factor.
Cooking performance can also explain why portion specifications sometimes need to include more than weight. A thin tail piece and a thick center-cut portion can weigh the same but cook differently. Where consistency matters, dimensions and cut position may be relevant purchasing requirements.
Calculate fabrication yield and cooking yield separately
Keeping fabrication loss and cooking loss separate makes it easier to see where purchased weight is going.
Suppose a whole or partly processed fish produces a 45% usable raw yield. If that usable fish then has a 70% cooked yield:
0.45 × 0.70 = 0.315
In this simplified example, 31.5% of the original purchased weight remains as cooked primary fish.
The original raw-material cost is therefore effectively divided by 0.315 when viewed at the cooked-product level. Before labor or other costs are added, that is approximately 3.17 times the original purchase cost per kilogram.
This does not mean that whole fish is automatically expensive. Usable trim may still have value, and actual yields can differ considerably by species and processing method.
It does mean that purchase price, fabrication yield, and cooking yield should be calculated separately. Each measures a different stage of the operation.
Usable trim can change the economics
Not everything removed during fabrication has to become waste.
Depending on the species, product quality, food-safety controls, and menu, frames and bones may be used for stock. Belly meat, tails, offcuts, or irregular pieces may be suitable for soups, mince, fish cakes, cubes, fillings, or other products.
Foodservice yield-costing guidance therefore allows usable by-products to be credited when calculating the cost of the primary portion.
Consider two businesses buying the same whole fish. One has a menu and production system that can use most of the trim. The other needs only uniform fillets and discards the rest.
Their physical fillet yield may be identical, but the financial result is different.
This is one reason there is no universal answer to whether whole fish, fillets, loins, or ready-cut portions are cheaper. The better choice depends partly on whether the buyer can recover value from the parts that do not meet the main cut specification.
Frozen seafood buyers should check what the stated weight includes
Yield calculations can become misleading if the quoted frozen weight does not represent the amount of seafood the buyer expects to receive.
Frozen fish is often glazed with ice to help protect it from dehydration during storage. Under the Codex standard for quick-frozen fish fillets, the declared net contents of glazed products exclude the glaze.
Glaze itself is not necessarily a quality problem. For purchasing, the issue is whether the buyer and supplier are comparing products on the same weight basis.
The commercial effect can be large enough to justify checking. On September 2, 2025, the US FDA published results from a sampling assignment covering imported frozen seafood collected between 2022 and 2024. Ten of the 28 retail samples tested were found to be short-weighted, with shortages ranging from 2.3% to 9.9%.
That result applies to the FDA sampling program and should not be treated as a global seafood-industry rate. It does show why buyers should define and verify net product weight instead of assuming that every quoted frozen kilogram contains the same amount of fish.
When comparing suppliers, product form, glaze specification, net weight, and yield should be reviewed together.
Compare cuts by cost per usable serving
A useful comparison between seafood formats needs to go beyond price per carton or price per kilogram.
For each option, record:
- purchase price and purchased weight;
- usable raw yield after fabrication;
- labor required for cutting, trimming, deboning, and portioning;
- number and average weight of usable primary portions;
- usable value recovered from secondary cuts or trim;
- cooking yield under the operation’s actual preparation method;
- and portion-weight consistency.
A trimmed fixed-weight portion, for example, may have the highest supplier price but require little fabrication and provide predictable plate counts. A loin may cost less while still offering relatively high usable yield and giving the kitchen more control over portion size. Whole or headed-and-gutted fish may provide more opportunities to use secondary parts, but they also require more skill, time, and yield management.
No single format is automatically the least expensive.
For importers, distributors, retailers, hotels, restaurants, and other foodservice businesses, a useful specification needs more than a species name and target price. Cut, fish size, skin and bone condition, trimming level, portion range, frozen-product weight, and intended use can all affect the product’s actual cost in service.
A seafood processor that can supply different cuts and size specifications gives buyers more choice over where those preparation steps take place. For buyers sourcing from processors such as Intan Seafood in Indonesia, defining the required market form and portion specification before comparing quotations makes it easier to compare suppliers on usable product rather than headline price alone.
The lowest purchase price may not produce the lowest menu cost
Fish cuts and portion sizes affect how much usable fish remains, how much work is needed before service, and how consistently the product can be converted into menu portions.
Less processed fish can make economic sense when a business has skilled labor and profitable uses for trim. More processed formats can make sense when predictable serving counts, lower preparation requirements, and consistent portions matter more.
The most reliable comparison comes from testing the actual product. Measure fabrication yield, calculate usable cost, record the labor involved, test cooking yield, and check actual portion weights. With those figures in hand, buyers can compare seafood formats based on the cost of the serving they can sell rather than the kilogram they initially purchased.
References
- NOAA Seafood Inspection Program — Grading Standards and Procedures
- FAO — Yield and Product Information for Fish Processing
- Basic Kitchen and Food Service Management — Yield Testing
- USDA Food Buying Guide — Fish Fillets Yield Example
- Indonesian Fisheries Research — Tuna Processing and Fish Size Yield
- Indonesian Fisheries Research — Cobia Processing Productivity
- Codex Alimentarius — International Standards for Fish and Fishery Products


